
Team Trees Followup
https://youtube.com/shorts/BPQ1x9ra5js?si=Q2-hvXj9i_xep11Q - well plug
$1.00 = 1 Tree at a scale of 20MM means that any deviation from the $1.00 price point results in massive margins or an impossible project, with every cent equal to a $200K deviation.
$1.01 trees = $200K over budget
$.99 trees = $200K left over
$.50 trees = $10MM left over
The following comes from independent audits of Arbor Days financials from 2019-2021. Also being analyzed are the publicly available tax returns from 2018-2021 and the Annual Reports from 2013 - 2021. Independent audits will be cross-referenced with tax returns and #teamtrees for a complete analysis of where money is being spent
https://www.arborday.org/about/documents/2020-aud-financial-statement.pdf
https://www.arborday.org/about/documents/2021-aud-financial-statement.pdf
(2019 is currently hidden, but I have file somewhere)
Other Sources include:
https://www.arborday.org/media/pressreleases/pressrelease.cfm?id=484
https://arbordayblog.org/replanting-our-national-forests/teamtrees-in-action/
https://www.prnewswire.com/news-releases/arbor-day-foundation-announces-initial-planting-locations-for-20-million-teamtrees-trees-300983610.html
2019
Notes
Carbon Inventory Size
$8MM Increase in Administration and Fundraising
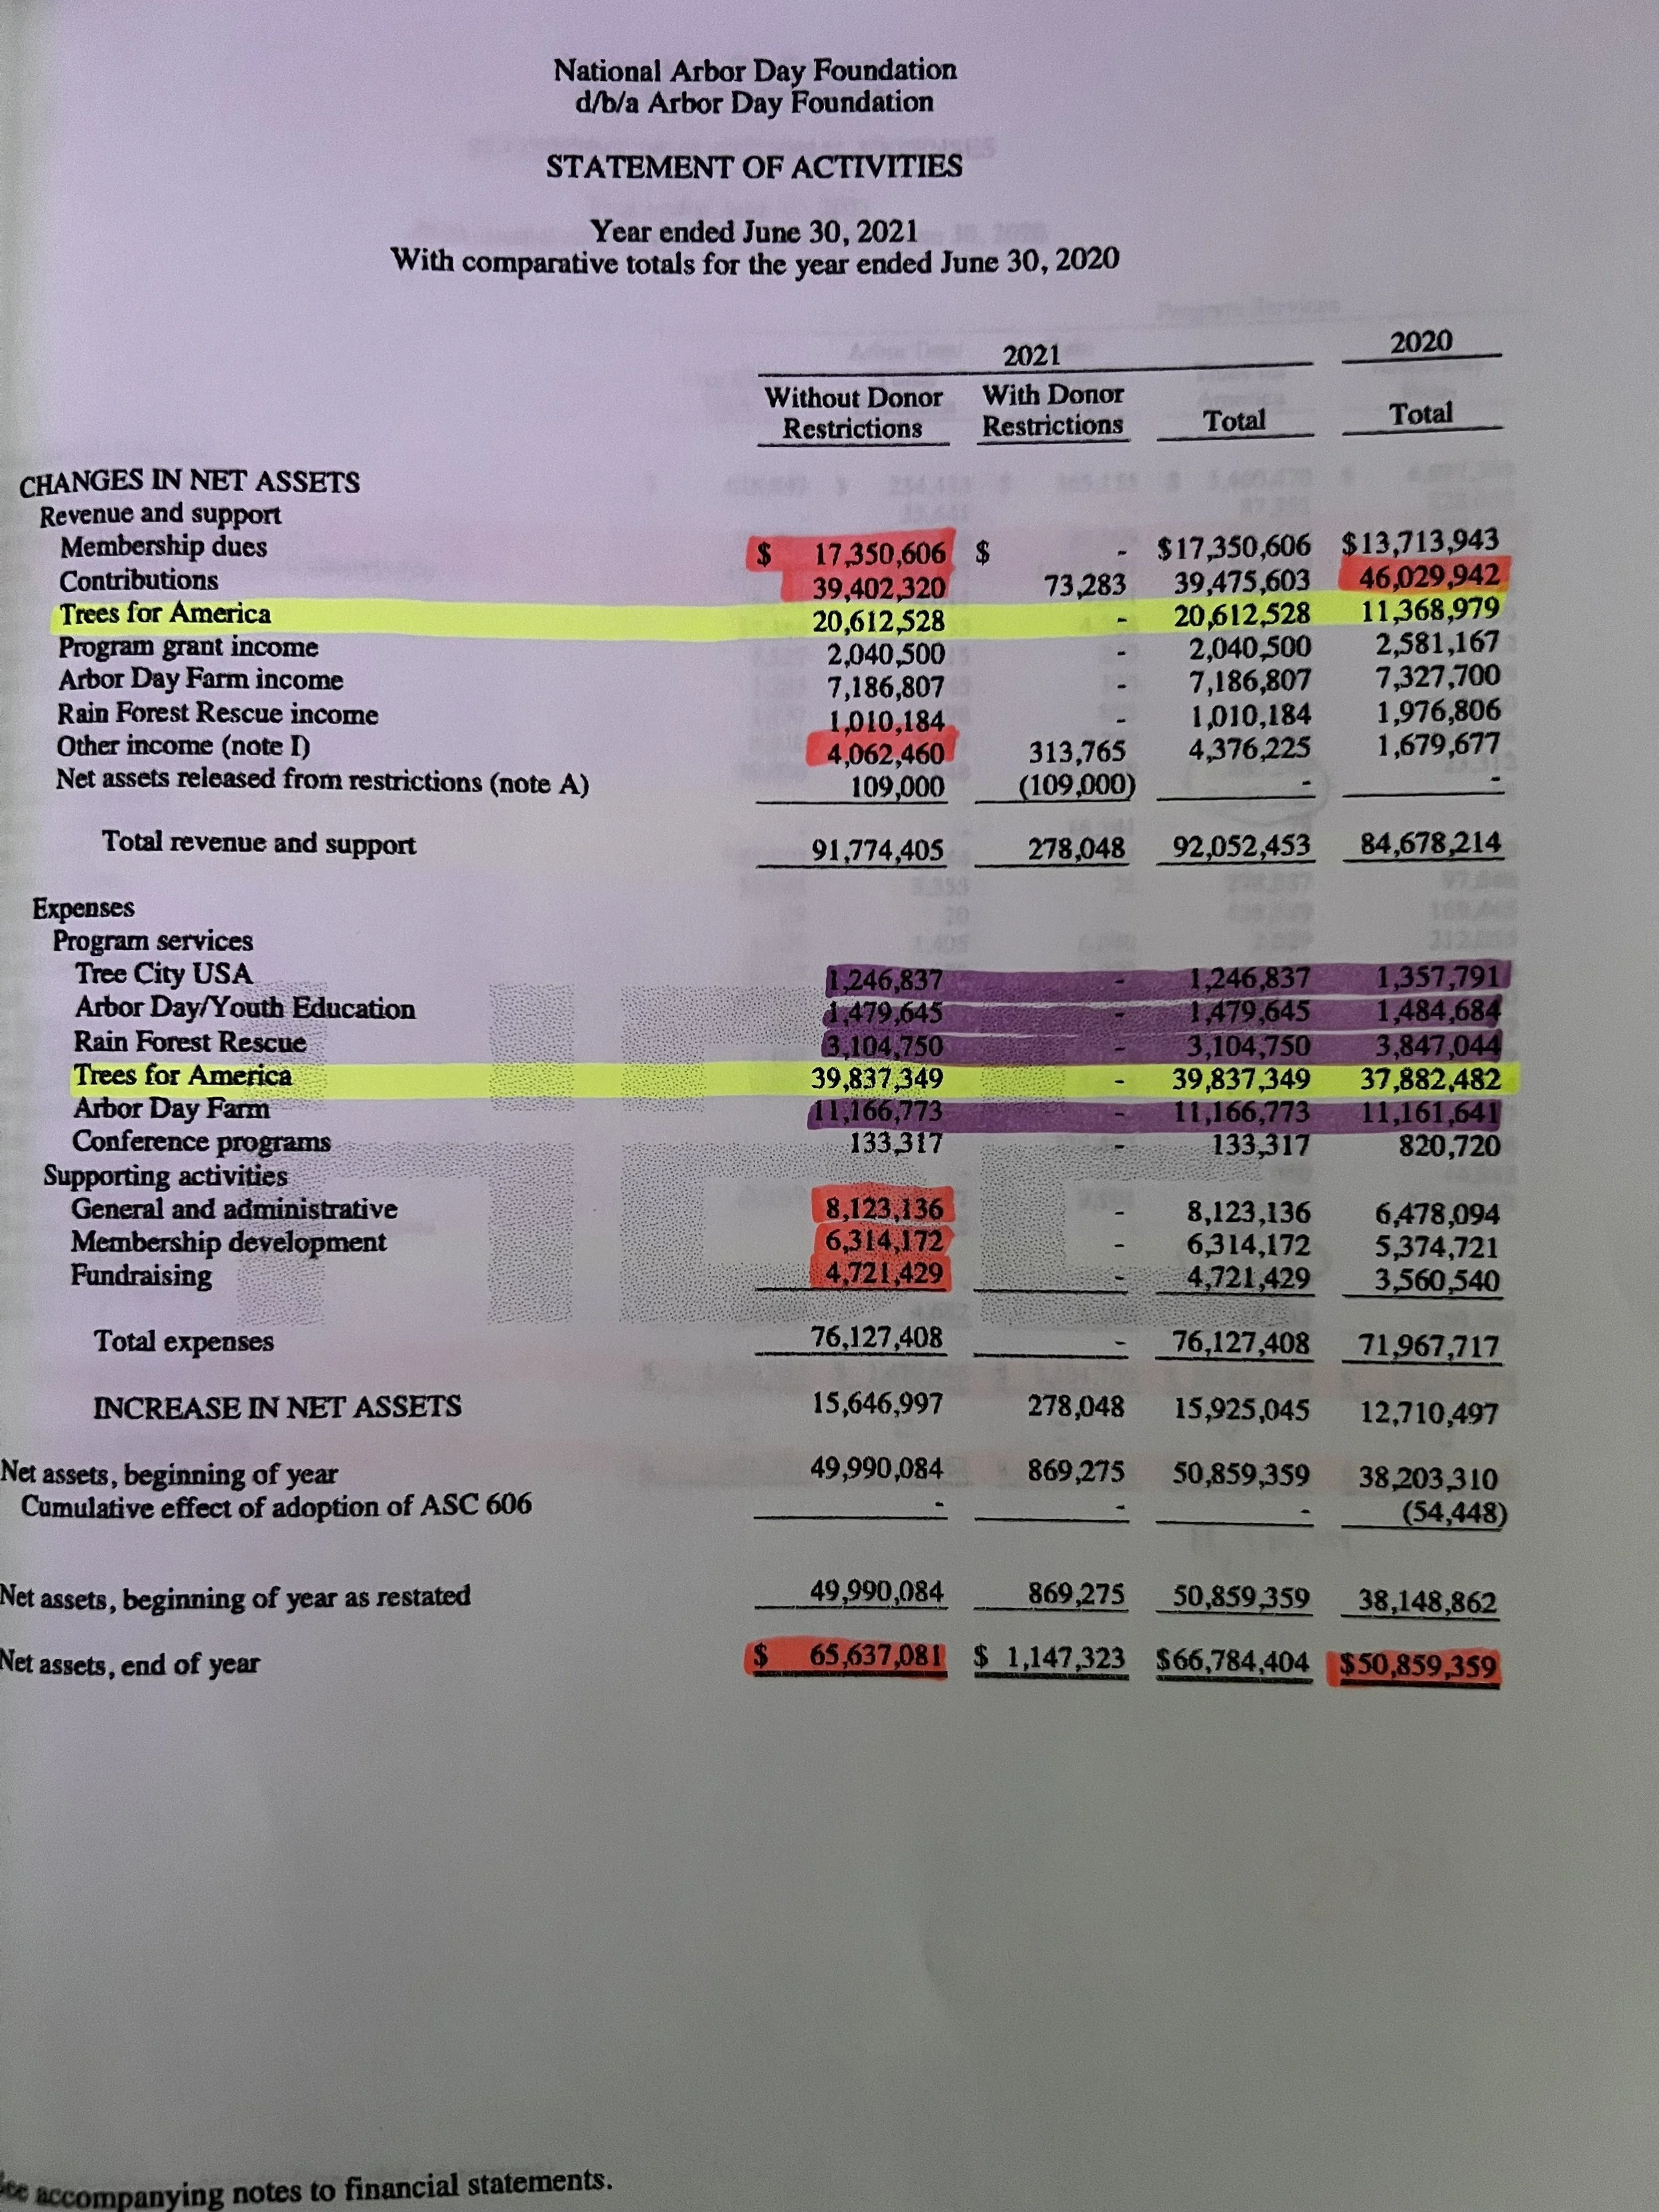
$9.7MM Increase in “Trees for America”


2020
Notes
$11MM CD Purchase
Cash from #teamtrees designated as “no donor restrictions”
$6MM in “inventory” (trees?)
$3.7MM increase in “Carbon Credits "(Who paid to? Existing trees or new farm?)
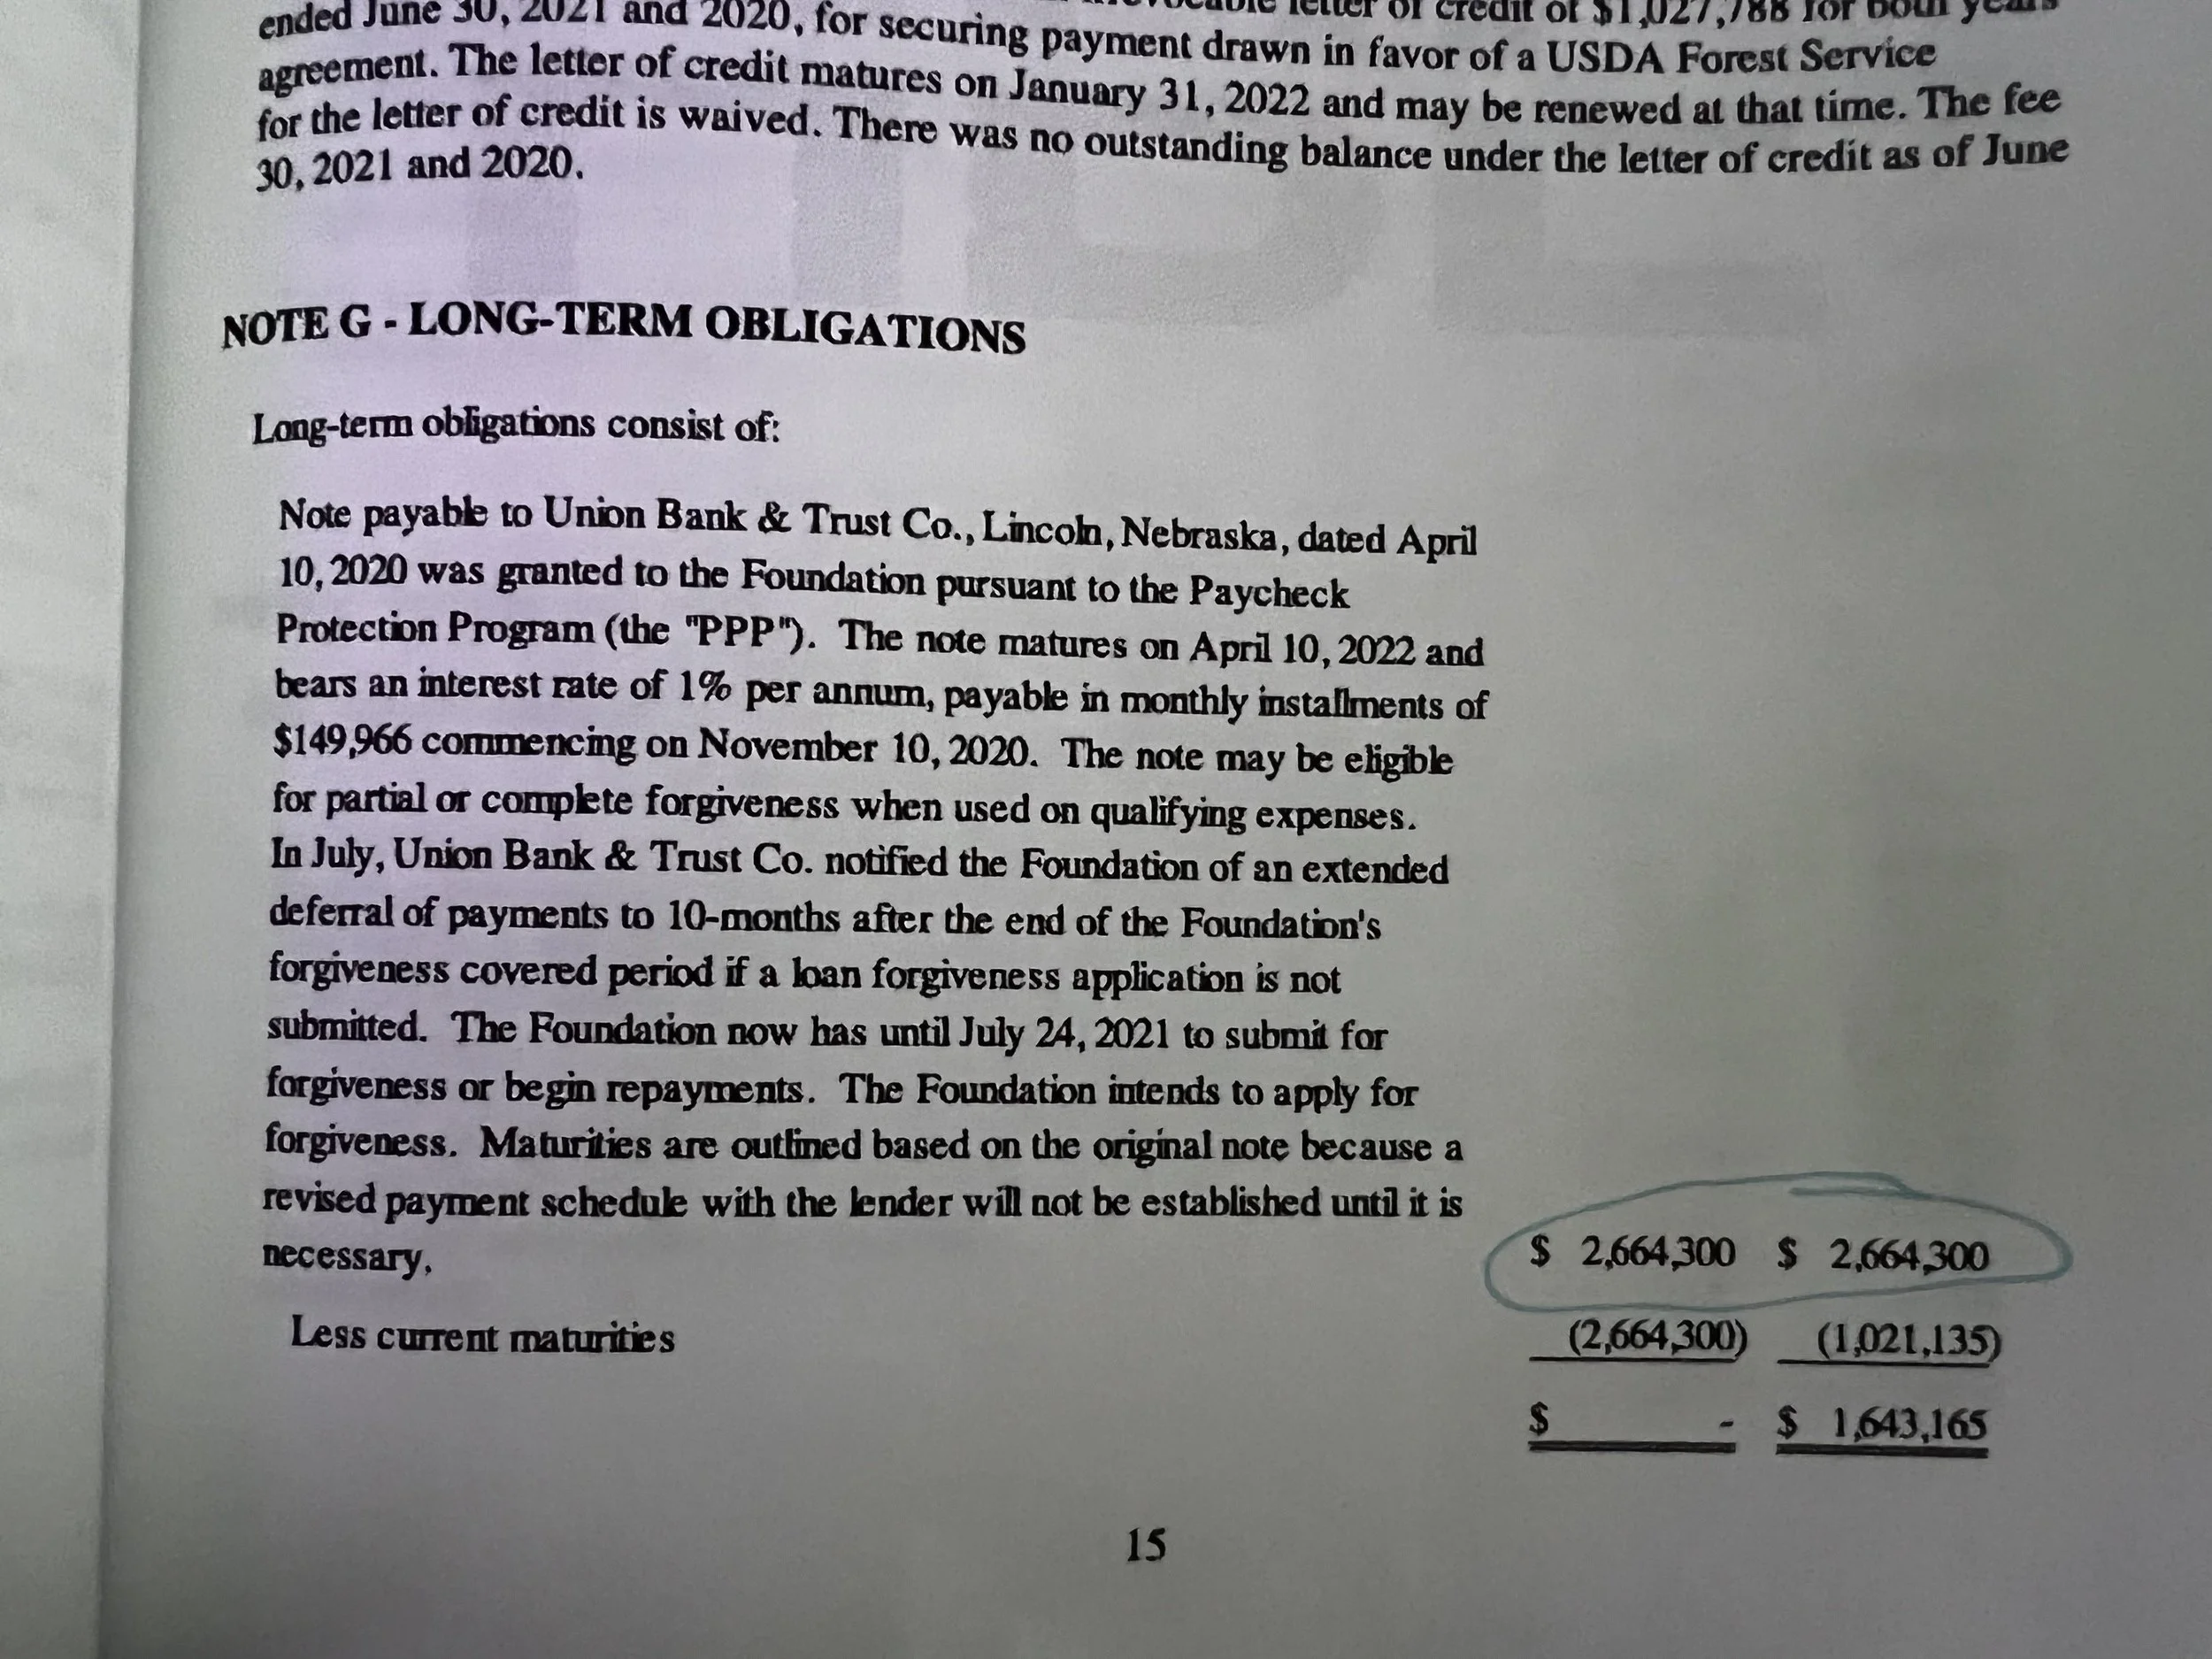
PPE Loan


2019
Notes
$10MM Increase in “Trees for America”
$4MM in “Other Income” (Investments/CD)
$4.2MM Increase in “Carbon Credits” (again, to who?)
PPE Loan forgiven


Reforestation Expenses
2018-2019: $7,247,298
2020: $14,246,897 (significant increase from previous years)
2021: $10,424,497 (stabilization begins)
2022: $10,995,181
2023: $10,996,306 (virtually no change from 2022)
2023-2024: $10,996,306 (consistent with 2023)
Observation:
Reforestation expenses peaked in 2020 but have since stabilized at around $11 million annually. This suggests that the Foundation has settled into a steady operational framework for these activities.
Reforestation Carbon Credit Expenses
2018-2019: $2,193,576
2020: $11,330,292 (dramatic increase aligned with heightened environmental market activity)
2021: $16,955,406
2022: $21,212,035 (largest single-year allocation noted)
Observation:
Spending on carbon credits has grown consistently and significantly, particularly between 2020 and 2022, reflecting the Foundation’s increasing focus on market-driven climate solutions.
One particularly odd detail is the impairment charge of $9,471,172 recorded in 2024 for reforestation carbon credits. Impairments at this scale are unusual and raise several questions:
Valuation Practices:
The decline in the estimated selling price of carbon credits suggests that the initial valuation may have been overly optimistic or that the market conditions changed dramatically in a short time.
If the market for carbon credits was known to be volatile, why was such a large sum invested without sufficient risk mitigation?
Timing and Scale:
This impairment is a standout because it dwarfs other adjustments or charges seen in prior years, hinting at either a market miscalculation or operational misstep.
Transparency:
Despite the significant financial impact, the narrative around why this impairment occurred is vague. There’s no detailed explanation of whether the issue stemmed from external market forces, poor internal oversight, or changes in project feasibility.
Why It’s Weird:
Carbon credits are a relatively niche and developing market. For the Arbor Day Foundation, which positions itself as a leader in environmental solutions, such a large write-off seems incongruent with the careful stewardship one would expect. It also begs the question of whether their push into the carbon market may have outpaced their expertise or capacity to navigate its complexities.Another oddity is the significant drop in forestry carbon sales revenue from $25,555,625 in 2023 to $14,648,867 in 2024. This sharp decline—over 43%—raises several questions:
Why It’s Odd
Unexplained Fluctuation:
The documents do not provide a clear explanation for this drastic drop, especially since the organization had consistently increased spending on carbon credits in prior years. One would expect higher expenditures to correspond with stable or growing revenue.
Market Dynamics:
If the decline is due to market volatility, this might indicate a riskier dependence on carbon credit sales as a revenue stream. This is particularly concerning for an organization that markets itself as a stable and sustainable environmental leader.
Operational Misalignment:
While expenses related to reforestation and carbon credits have remained steady or increased, the revenue decline suggests potential inefficiencies or a mismatch in strategy versus outcomes.
Timing and Transparency:
The decline coincides with the large impairment of carbon credits ($9.47 million in 2024). If the two are connected, this would suggest the organization made an ambitious investment in a declining market without adequate foresight.
Possible Explanations (and Why They’re Concerning):
Over-Reliance on a Volatile Market:
It’s possible that the market for carbon credits became oversaturated or that demand decreased in 2024, but there’s no supporting explanation in the provided audits.
Overvaluation of Assets:
The impairment might have been the result of a previous overvaluation of carbon credits, leading to unrealistic revenue expectations in prior years.
Shift in Donor Focus:
There may have been a decrease in corporate or institutional purchases of carbon credits if donors shifted focus to other environmental initiatives.
This discrepancy between revenue and expenses in the carbon credit program hints at strategic or financial mismanagement. It’s worth investigating further to understand how this aligns with donor expectations and the organization’s overall sustainability goals.
Inconsistent Reporting of Unrestricted Funds
Unrestricted Classification:
The #TeamTrees campaign was marketed with a clear promise: $1 donated equals one tree planted. However, the classification of these funds as “unrestricted” gives the organization flexibility to allocate them to broader operational or programmatic needs.
This flexibility might be practical, but it doesn’t align with the specific, outcome-driven promise made to donors.
Disconnect Between Fundraising and Spending:
Despite raising over $20 million through #TeamTrees, it’s unclear if all these funds were directly tied to tree planting projects or if some were used for administrative or other programmatic expenses.
For example, the rise in administrative and fundraising expenses during the same period suggests a portion of these funds may have been redirected.
Potential for Misalignment with Donor Intent:
If donors were under the impression that their contributions would go directly and entirely to tree planting, any diversion—even if legally permissible—could harm the organization’s reputation.
Key Financial and Operational Highlights
Revenue Trends:
Forestry carbon sales revenue dropped sharply from $25,555,625 in 2023 to $14,648,867 in 2024, signaling potential market volatility.
Impairments and Write-Offs:
A $9,471,172 impairment charge was recorded in 2024, attributed to declines in the estimated selling price of carbon credits. This raises questions about valuation practices and market strategy.
Growth of Carbon Credit Initiatives:
Arbor Day Carbon, LLC, launched in 2021, has become a major player in the voluntary carbon market, facilitating transactions for over 7.5 million credits by 2023.
Audit Findings:
In 2024, compliance issues were flagged, particularly around the reporting of subawards under federal regulations, reflecting weaknesses in internal controls.
#TeamTrees Campaign
Funds were primarily directed towards:
Reforestation efforts in global areas impacted by deforestation, natural disasters, and ecological degradation.
Urban forestry and community recovery projects.
Supporting international projects such as mangrove restoration in Madagascar and forest replanting in the Amazon.
Concerns:
Limited transparency in fund allocation. While aggregate totals are reported, it is difficult to track the exact application of #TeamTrees funds to specific projects.
Potential Concerns and Areas for Further Scrutiny
Carbon Credit Valuations:
The impairment in 2024 suggests a need to revisit how these credits are priced and forecasted.
Revenue Sustainability:
The sharp decline in forestry carbon sales revenue between 2023 and 2024 indicates reliance on a volatile market.
Alignment with Donor Expectations:
Ambiguity around unrestricted funds from #TeamTrees may lead to donor concerns about whether their contributions were used as intended.
Administrative Costs:
Administrative and fundraising expenses have steadily increased, which could raise questions about operational efficiency.
The Simplistic $1 = 1 Tree Equation
The $1 = 1 tree formula is marketed as a straightforward promise, but the cost of tree planting varies significantly based on factors such as:
Location (e.g., developed countries vs. developing countries)
Type of tree species and size (e.g., saplings vs. mature trees)
Labor and logistical expenses (e.g., volunteer vs. professional planting)
Oddity:
Some trees planted under #TeamTrees were priced at less than $1 (e.g., smaller saplings in bulk purchases), while others—such as those planted in developed regions—likely exceeded $1. This suggests that $1 = 1 tree is an oversimplification, which isn’t clarified in financial or impact reporting.
Lack of Transparency on Cost Breakdown
Financial reports and audits don’t provide a clear reconciliation of how the $1 raised per tree promise aligns with actual costs. For instance:
Labor, shipping, and logistics are either omitted or generalized under “reforestation expenses.”
Donors might reasonably expect each dollar to directly fund tree planting, but operational overhead and potential cost variations are not explicitly acknowledged.
What Happens When Costs Don’t Match?
If a tree costs less than $1:
It’s unclear whether the excess funds are used to plant additional trees, reinvested into operational overhead, or directed elsewhere.
If a tree costs more than $1:
There’s no clarification about how these costs are subsidized or balanced. Are surplus funds from cheaper plantings used? Or does the organization absorb the difference?
Evidence from Financials
2018-2019 to 2022: Reforestation expenses have fluctuated significantly, but these fluctuations aren’t directly correlated with #TeamTrees fundraising totals or the number of trees planted. For example:
In 2020, $14,246,897 was allocated to reforestation, while reforestation carbon credit purchases were $11,330,292. How these expenses relate to specific campaigns like #TeamTrees is unclear.
Implications
Donor Expectations: The $1 = 1 tree promise is compelling but doesn’t reflect the complexity of tree planting at scale. Without clear cost breakdowns, donors might feel misled.
Operational Risks: The oversimplification places pressure on the Foundation to maintain this ratio, potentially leading to opaque reporting or financial trade-offs.
Funds Directed to Tree Purchases:
Commitments to purchase significant amounts of trees are evident in multiple fiscal years. For instance, in 2020, the Arbor Day Foundation had commitments to purchase trees amounting to $2,671,852 .
Expenditures Categorized Under Trees for America:
Expenses for Trees for America—a program closely aligned with Team Trees initiatives—reveal increasing allocations:
2020: $37,882,482 .
2024: $62,719,915 .
While this program encompasses broader reforestation efforts, it strongly ties to the mission of Team Trees.
Reforestation as a Major Expense:
Reforestation and related projects dominate a large portion of the financial statements, aligning with the reported aim of planting trees.
Carbon Credit Integration:
Expenses for reforestation often overlap with purchasing carbon credits for sustainability goals. For instance, the documents mention open commitments for reforestation carbon credits in 2020 valued at $5,417,858 .
Long-Term Commitments:
Some funds and liabilities allocated for tree planting extend beyond a single fiscal year, suggesting a staged approach in fulfilling Team Trees commitments.
The above allocations indicate that a substantial portion of the funds raised through Team Trees has likely been invested in its stated mission. However, some of these expenditures are broadly categorized, and while they align with the goals, they are not exclusively detailed as “Team Trees.” This makes tracing every dollar explicitly to the initiative more complex.
The investigation has provided a comprehensive look into the financial and operational practices surrounding the #TeamTrees campaign and the Arbor Day Foundation’s broader efforts. By analyzing 990 filings, audits, and annual reports from 2018 to 2024, key insights have emerged about how funds have been allocated, with both encouraging progress and notable concerns.
Reforestation and Spending Trends
Reforestation expenses have been consistently high year-over-year, reflecting a strong commitment to environmental restoration. However, the specific linkage between these expenditures and the #TeamTrees campaign remains unclear. While the promise of $1 = 1 tree has been a central focus, reconciling the simplicity of this claim with the complexities of global tree planting costs is challenging. Transparency gaps in expense breakdowns have made it difficult to assess whether the campaign’s promises have been fully realized.
Carbon Credits and Revenue Discrepancies
Carbon credit investments have grown significantly, demonstrating the organization’s pivot toward climate-focused strategies. Yet, this effort hasn’t been without its challenges. The $9.47 million impairment in carbon credits recorded in 2024 points to valuation risks and market volatility, raising questions about the sustainability of these investments. Additionally, a sharp 43% drop in carbon credit revenue from 2023 to 2024 underscores potential operational or market-related issues that warrant further scrutiny.
Broader Implications and Questions
Tree planting projects have spanned numerous regions globally, from U.S. National Forests to Madagascar’s mangroves and the Amazon Rainforest. While these initiatives align with the Arbor Day Foundation’s mission, they complicate donor-specific accountability. The use of unrestricted funds from #TeamTrees adds another layer of uncertainty, leaving questions about whether donor intent has been fully honored.
This investigation has laid a solid foundation for understanding the successes and challenges of #TeamTrees and Arbor Day Foundation initiatives. However, the disconnects between fundraising narratives and financial transparency require closer examination to ensure donor trust and organizational accountability.